Example
SPX during the 2020 COVID Crash
The 2020 Coronavirus pandemic marked a period of extreme market volatility, with the VIX setting a new all-time closing high of 82.69 on March 16, 2020. These conditions led to the emergence of unprecedented SPX volatility surface shapes for a good part of March 2020, even compared to the last big crash, the 2008 Global Financial Crisis.
Whereas the ATM vol term structure showed a sharp spike on the short in 2020 and 2008 (no surprise), the vol curve shapes were quite different during the covid crash:
- For multiple days the ATM curvature (“curv” in the plot) was negative for ALL expiries, from 0 to 3 years. This has never happened before (or since) in the history of options trading.
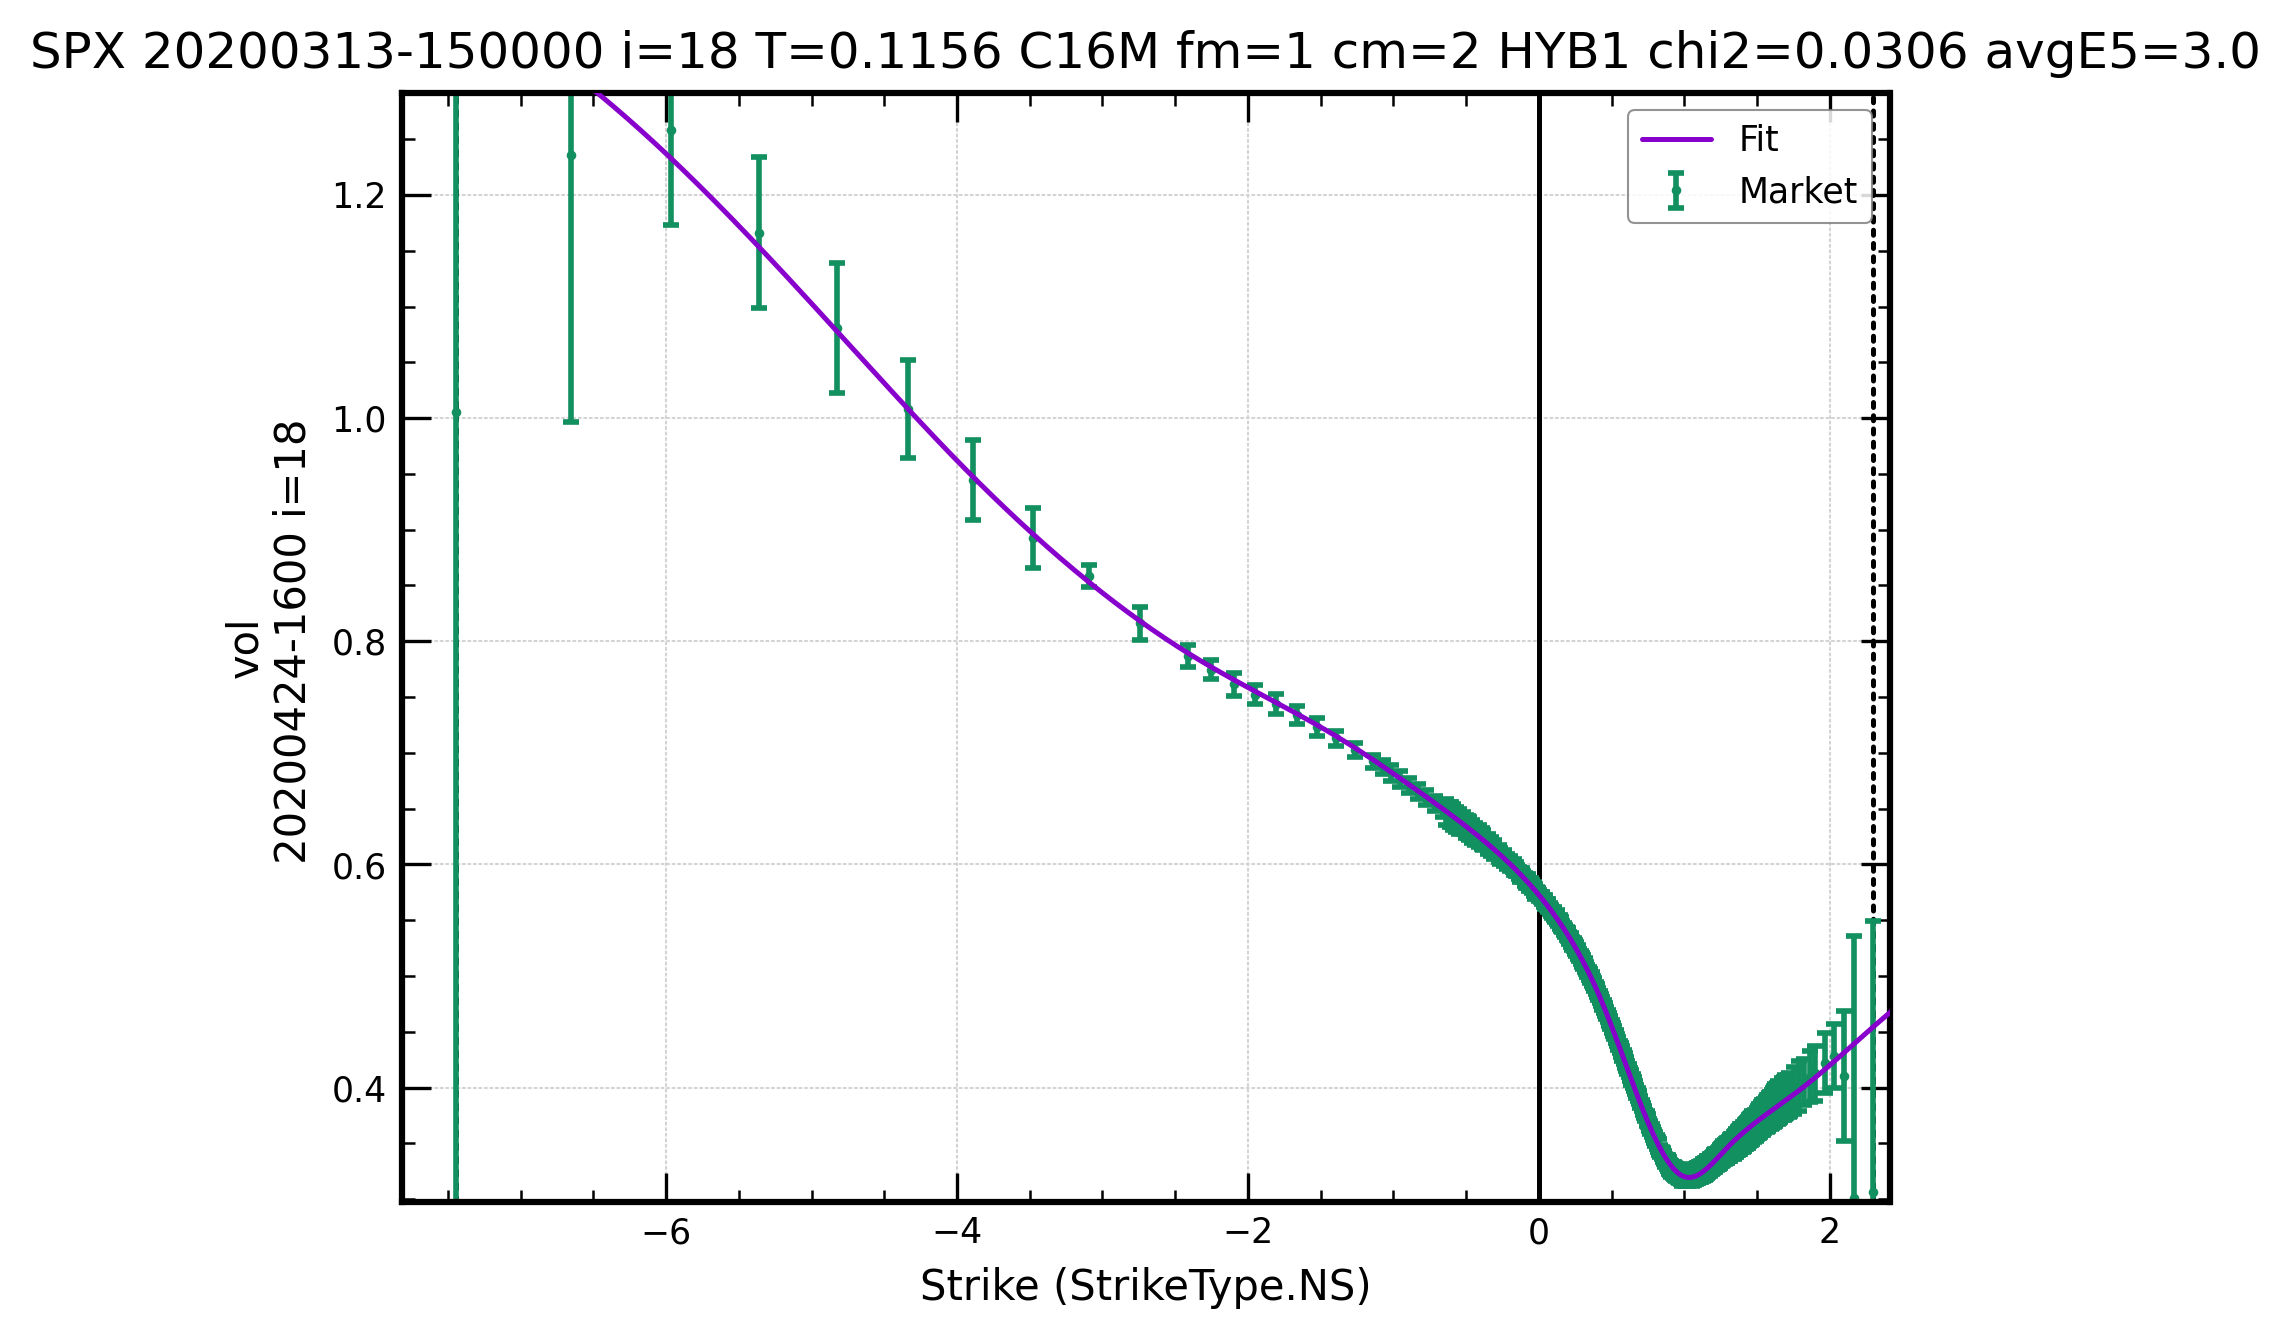
- Similarly, the near call wing slopes around normalized-strikes (NS) of approximately 0.5 exhibited exceptionally steep (negative) values, much steeper than around ATM. Again, there was no precedent for this behavior in earlier times; and it hasn’t happened since.
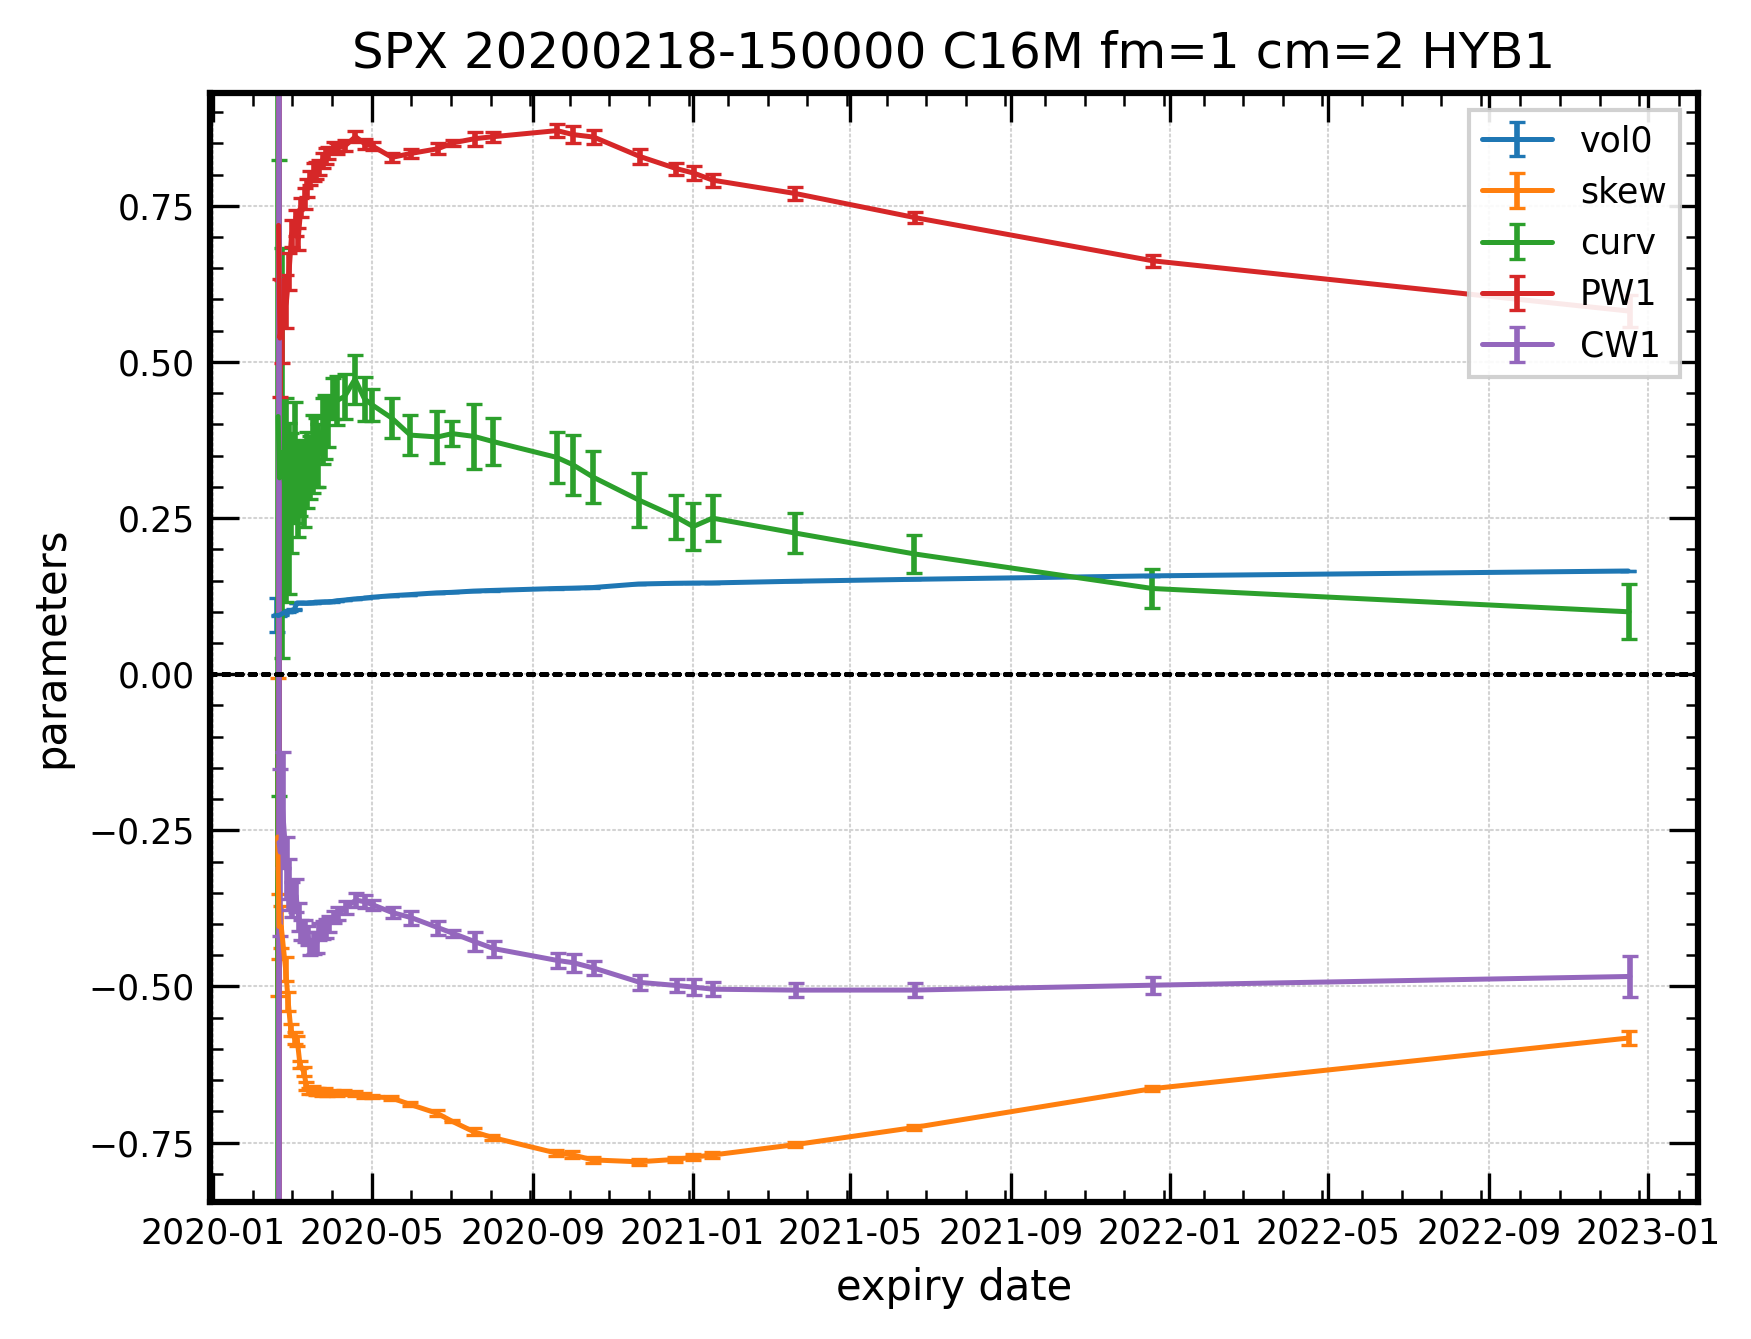
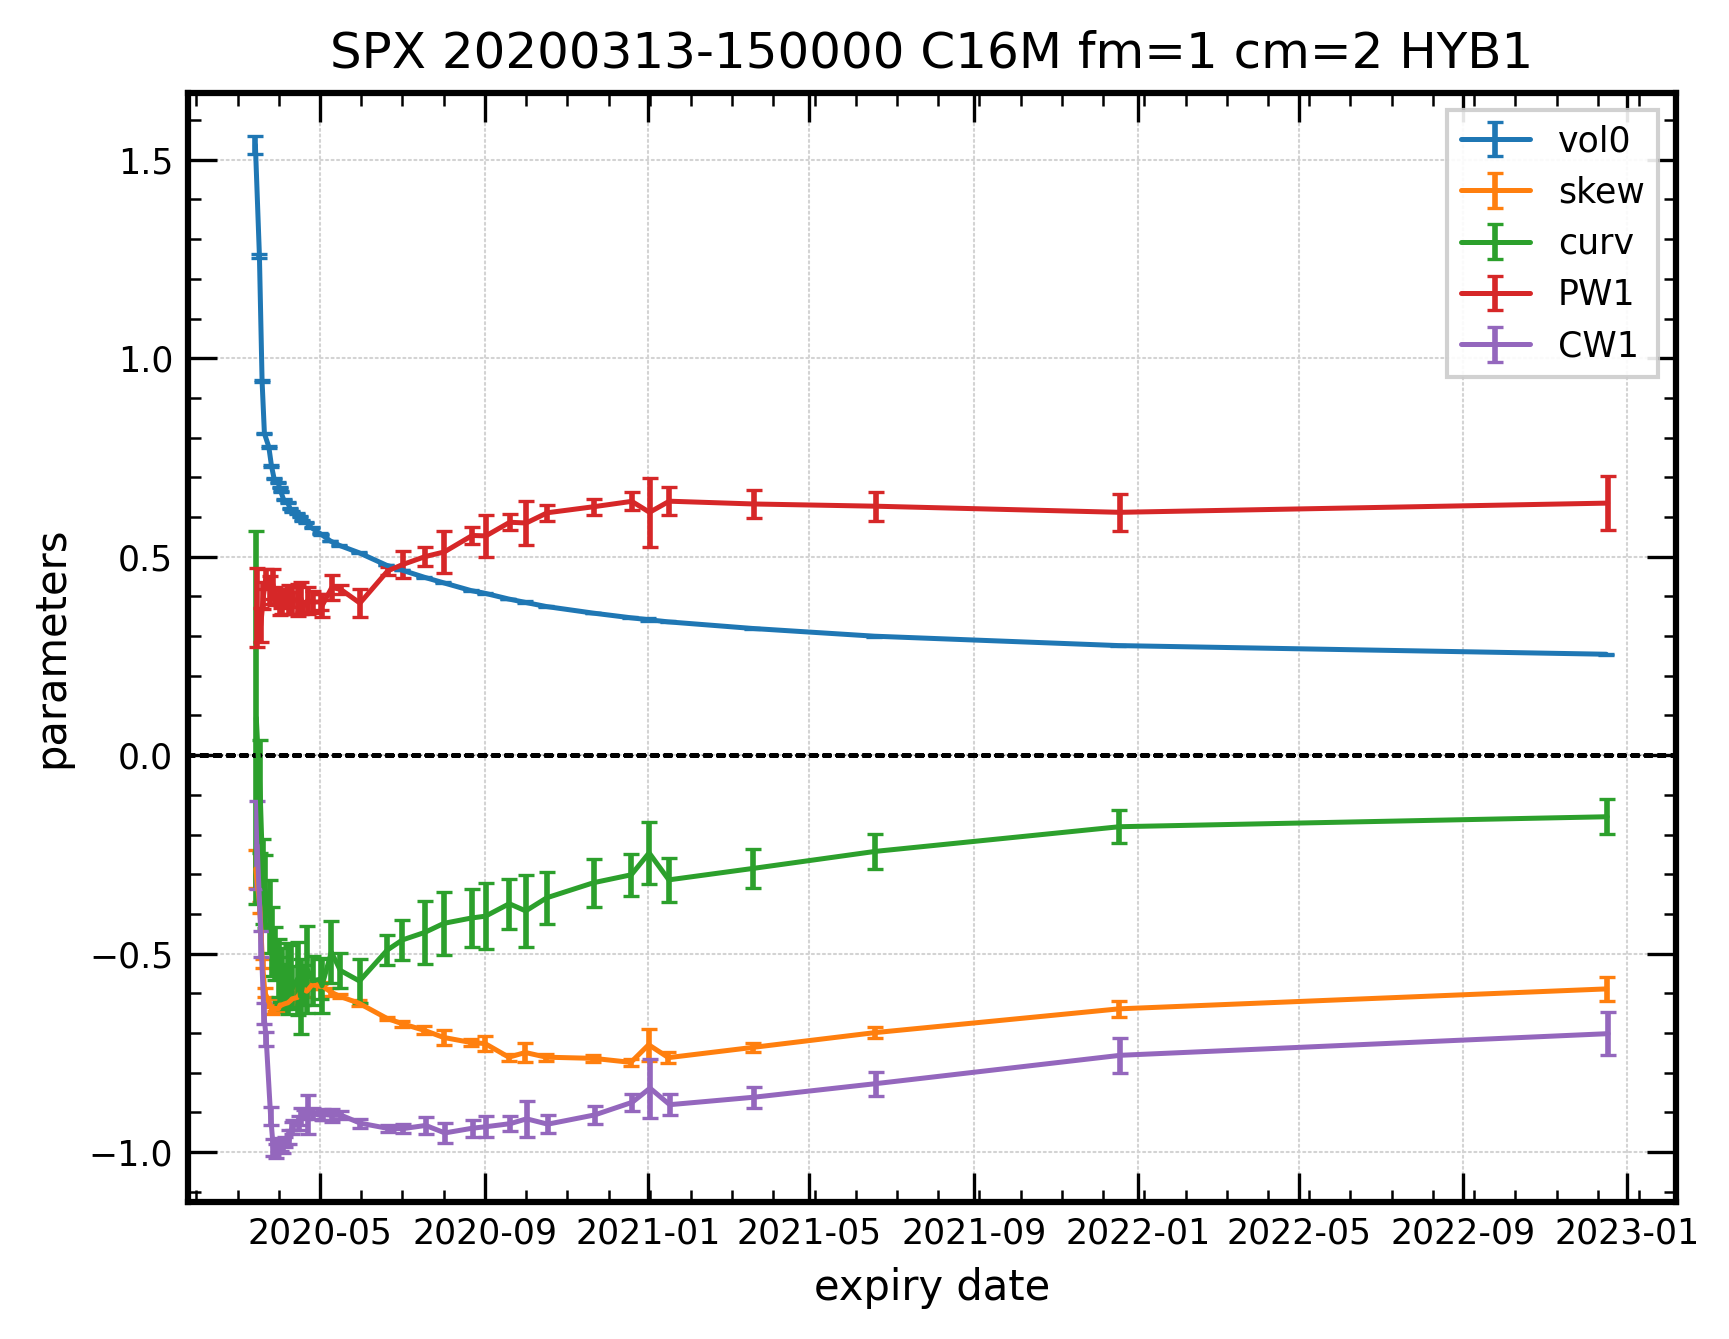
The near call wing slopes are quantitatively captured by our “CW1” parameter, and the above points are illustrated in the plots on the left, where we show the term structure of the first 5 vol parameters from an SPX fit 3 weeks before the crash (20200218) and during the crash (20200313).
Beyond this steep call wing, a distinct “knee” (representing the minimum volatility) appeared just above an NS of 1.0, indicating the complex structure that requires a sophisticated fitting approach.
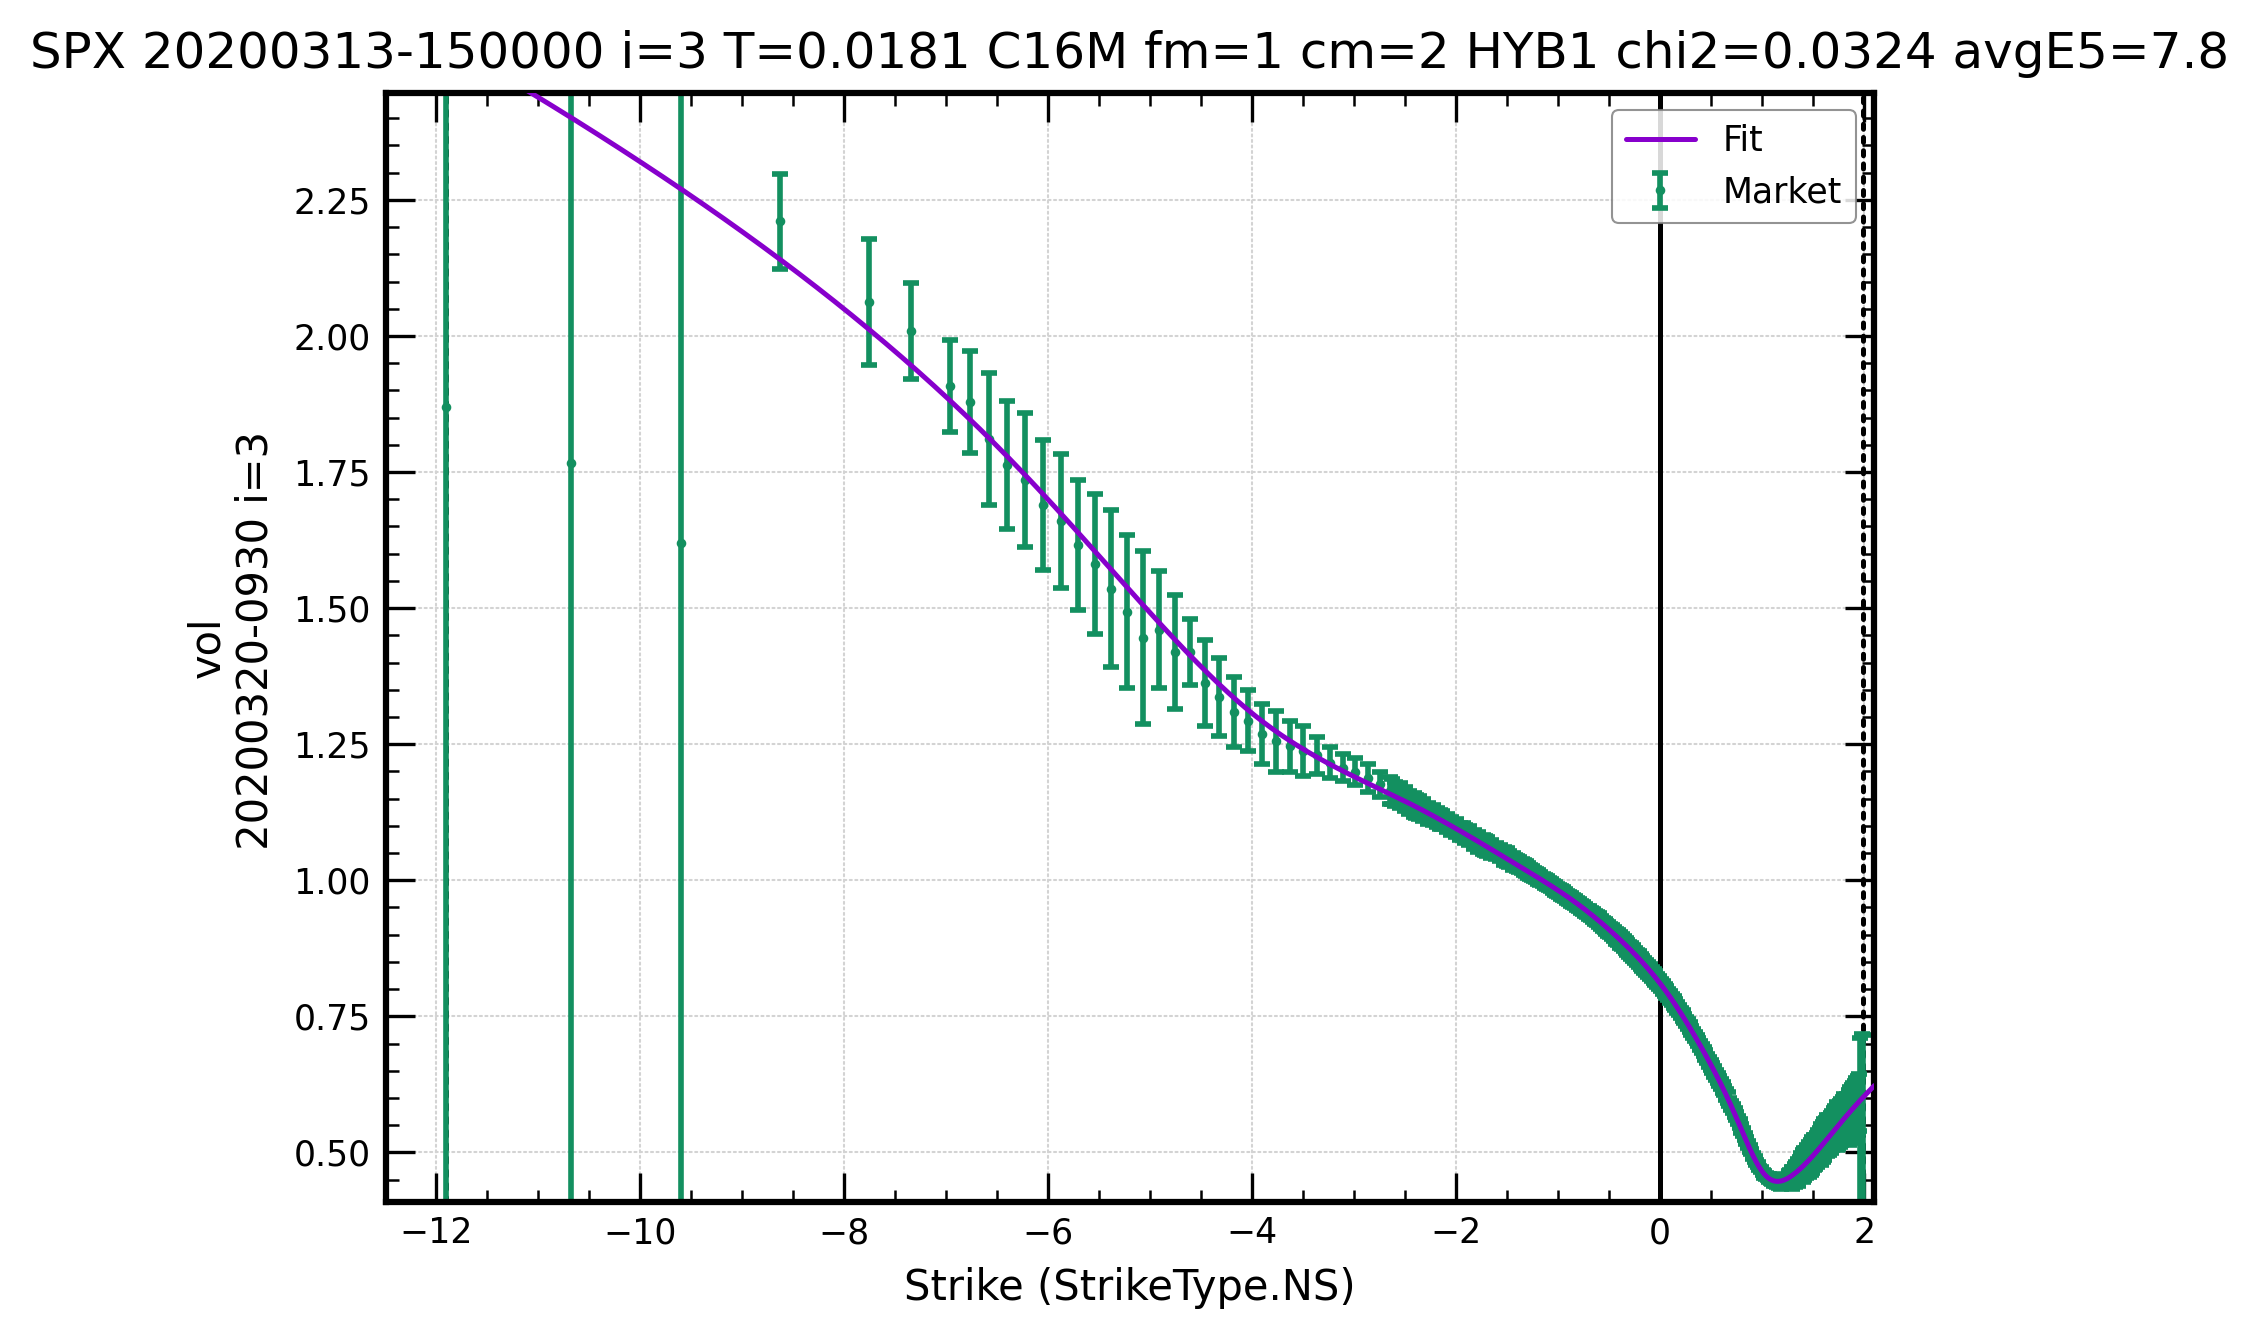
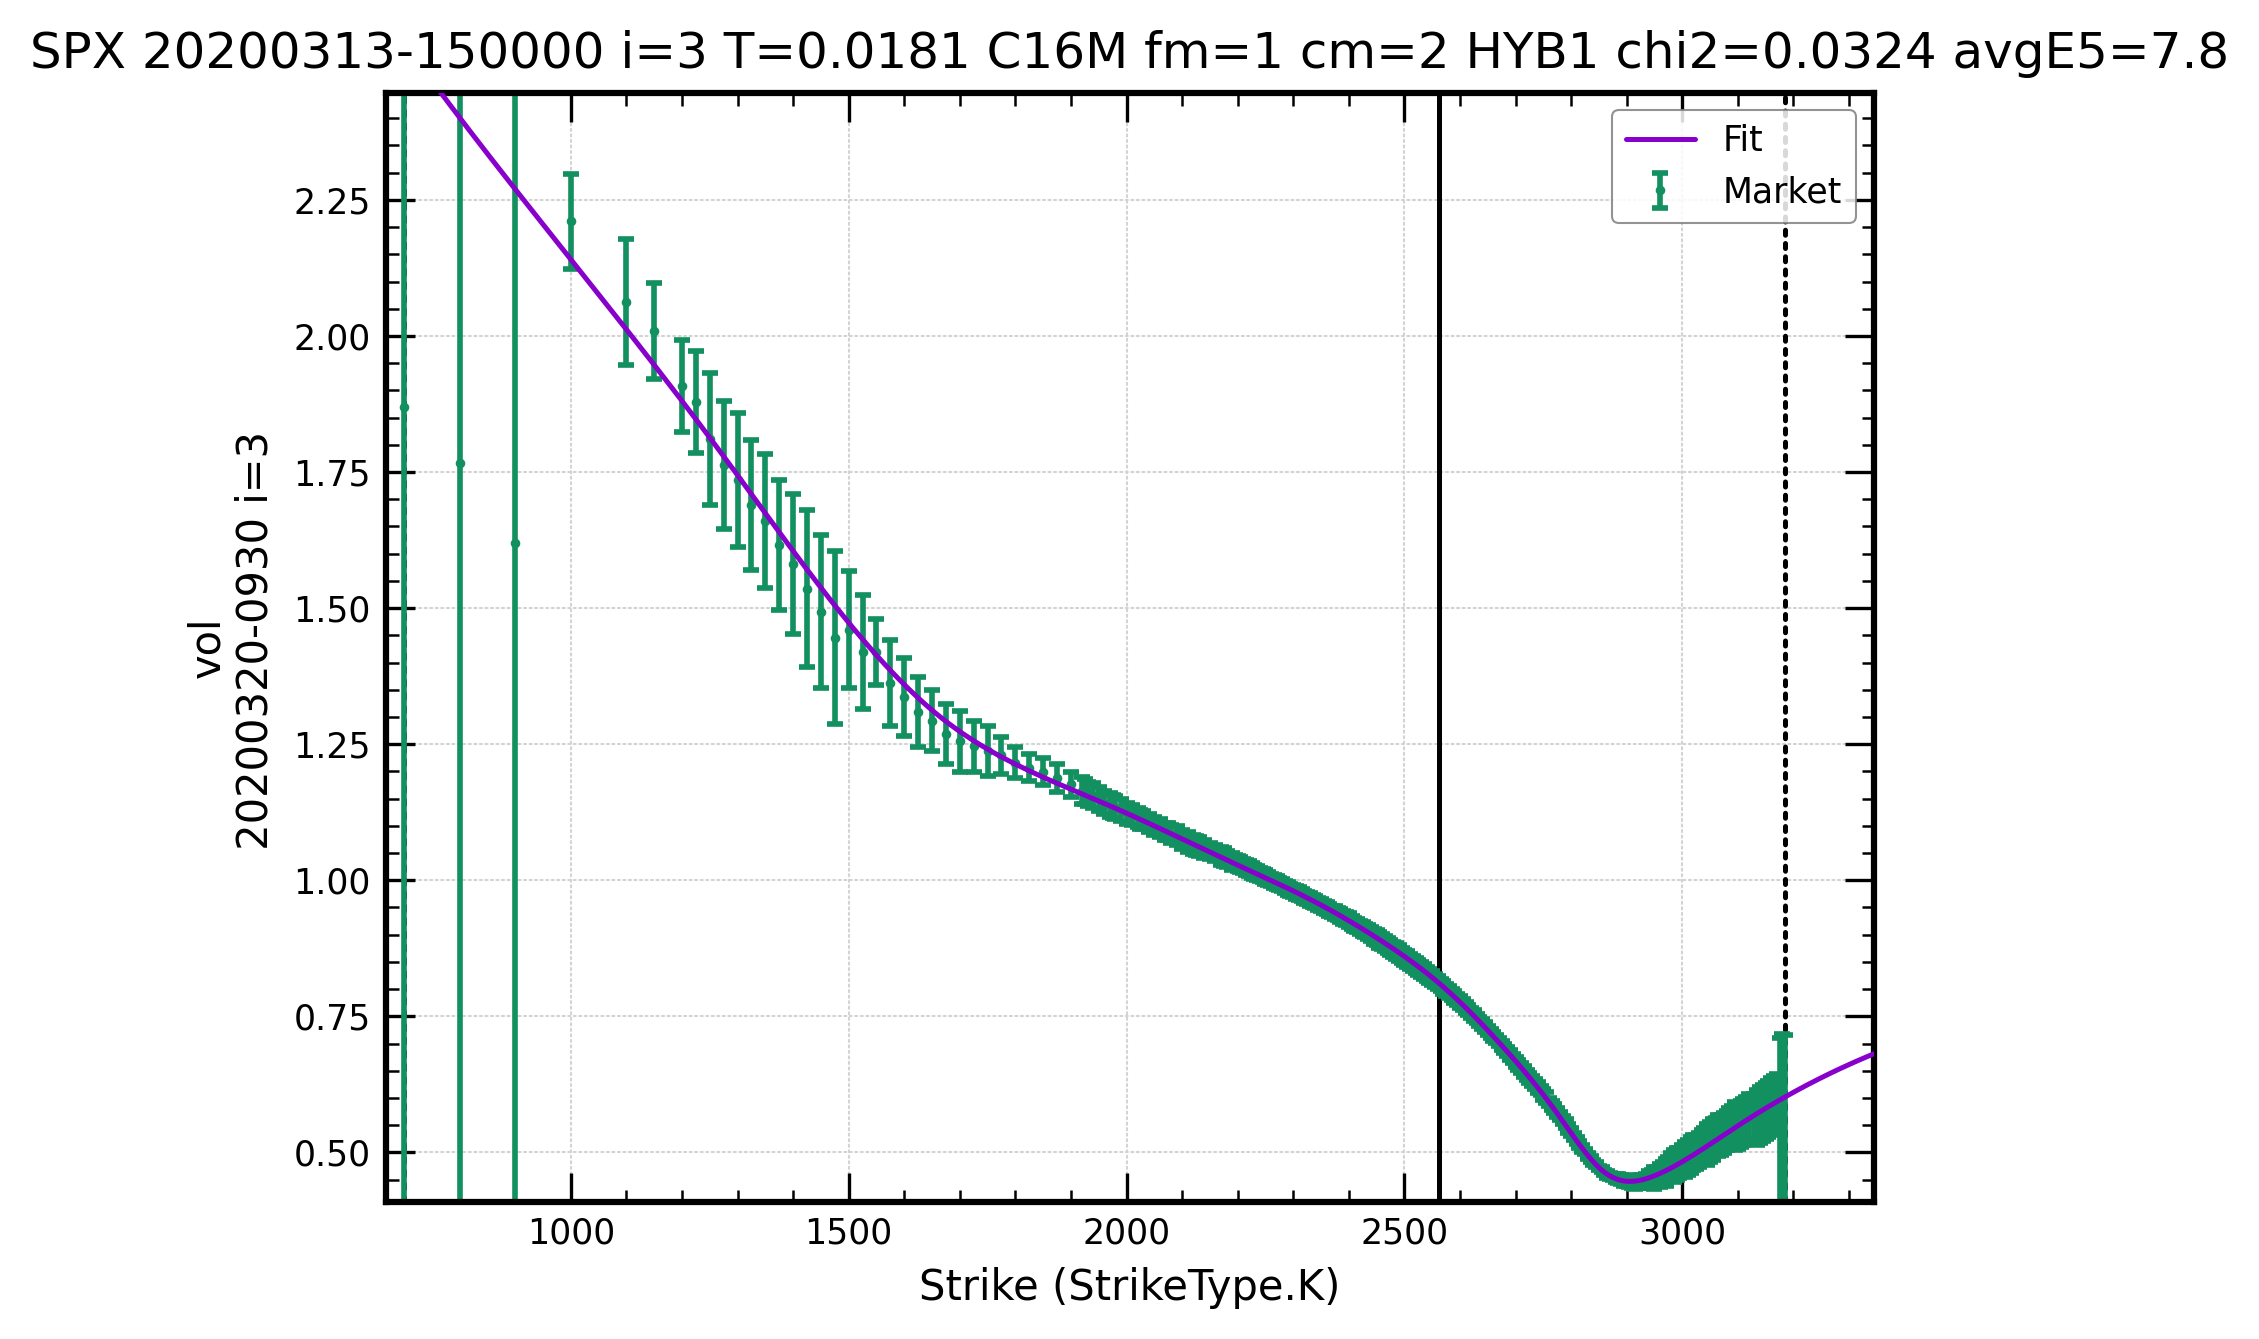
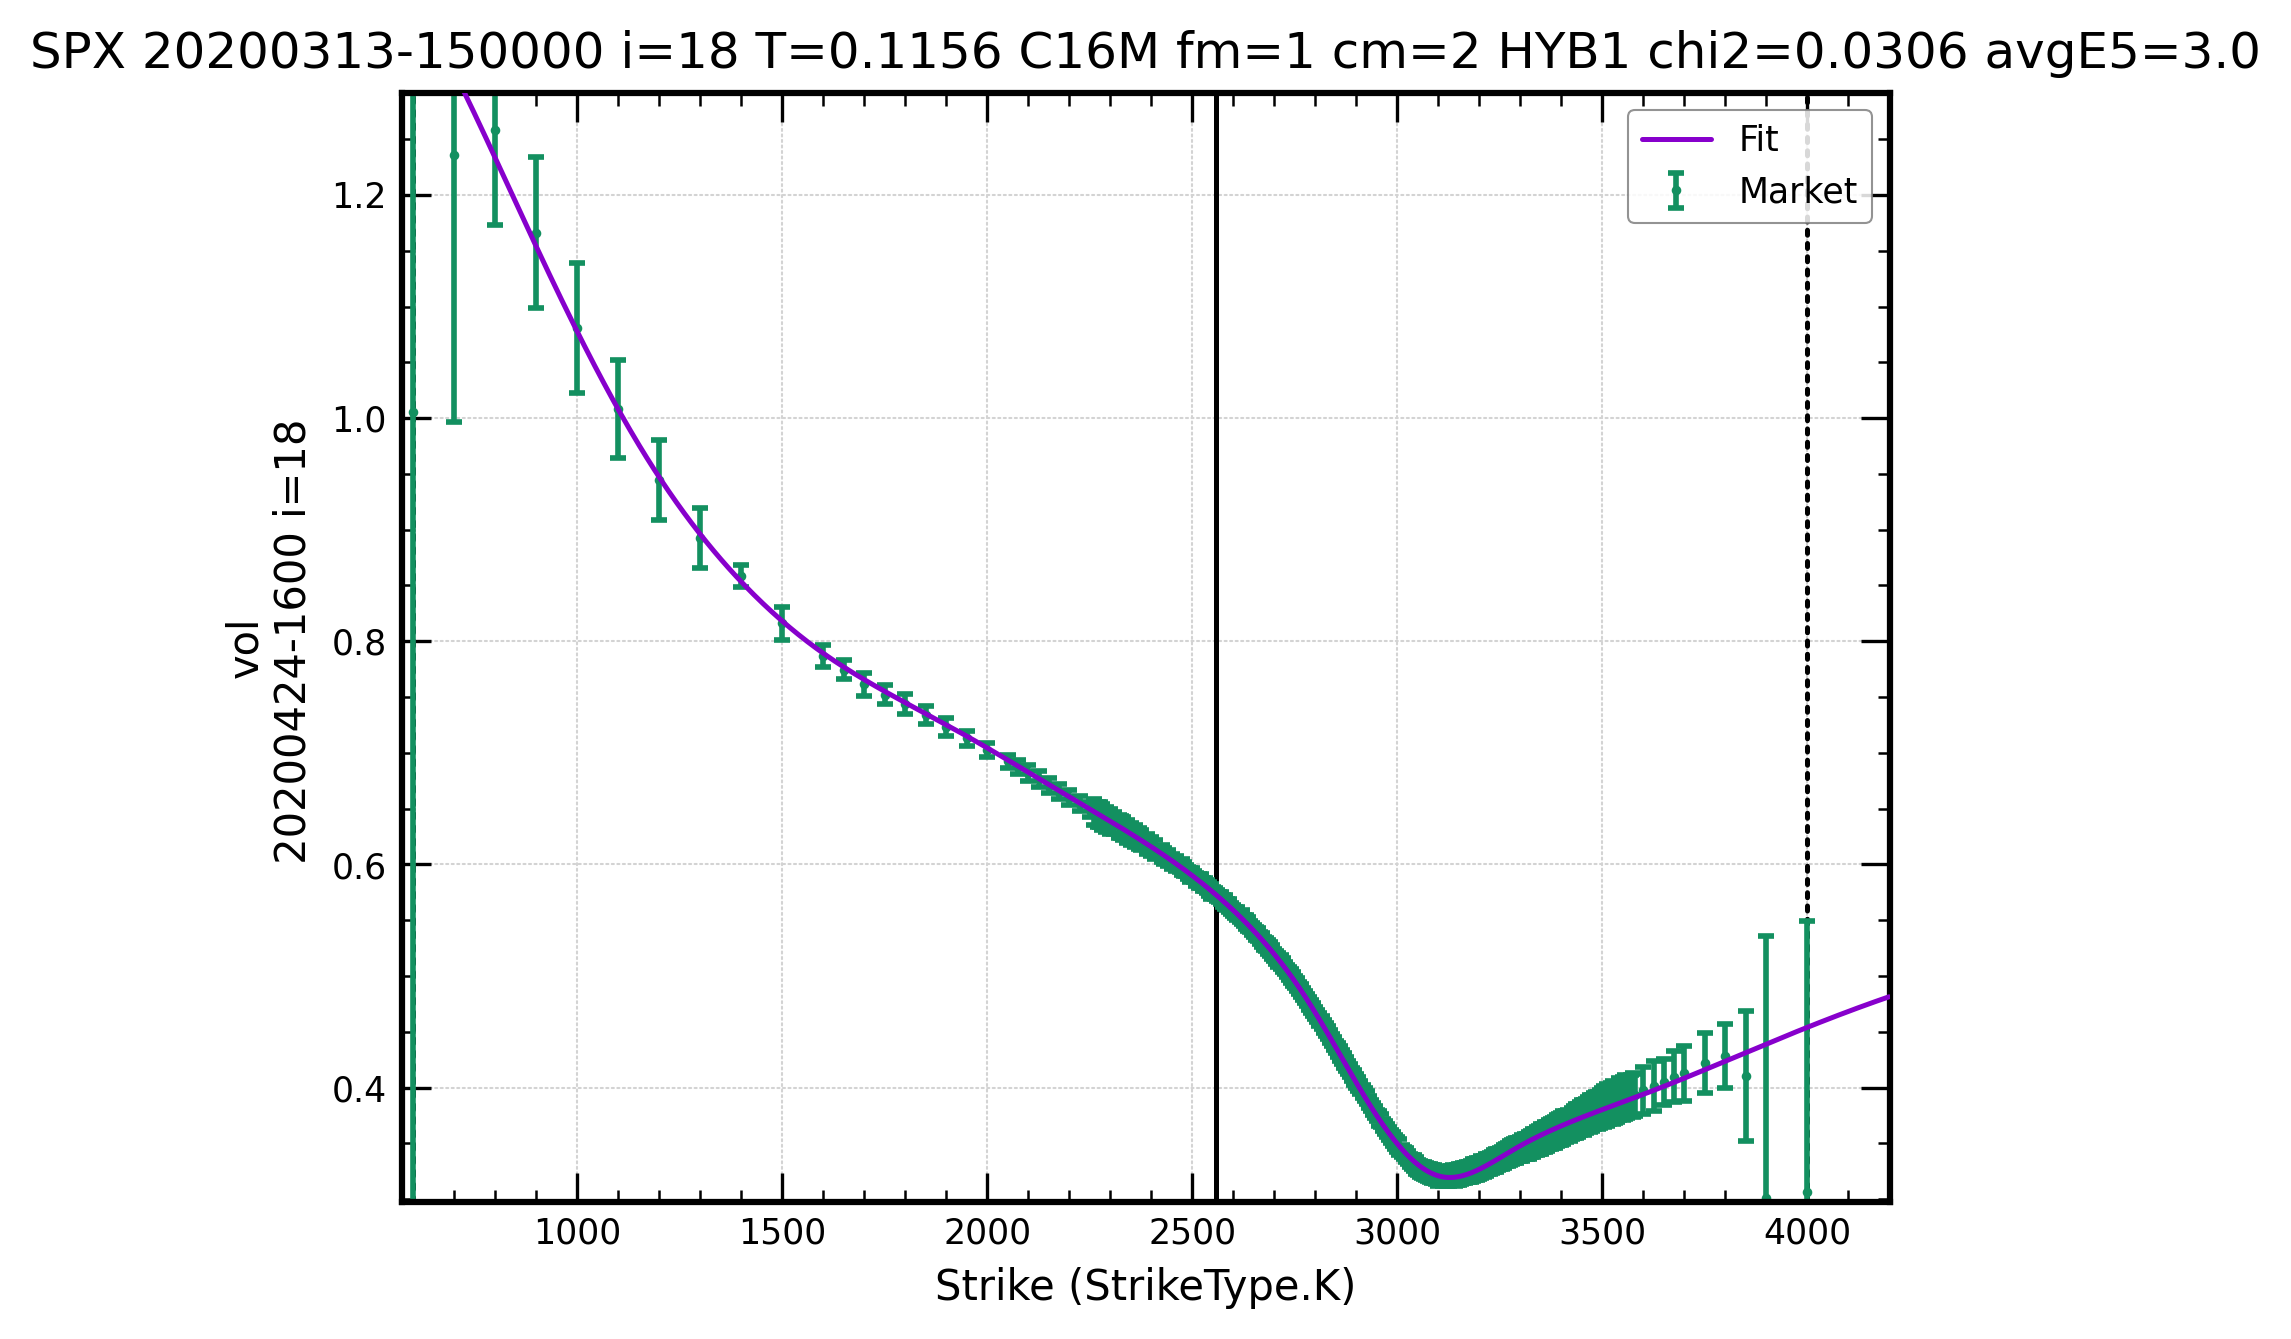
For reference, we show T=1w, 6w expiries in strike space and normalized strike space.
These curves, while unusual, reflect the market’s opinion regarding future underlier scenarios.
For instance, the implied densities for all terms were often bi-modal, featuring peaks on each side of the at-the-forward (ATF) level, a steep fall-off on the call side, and a very fat tail on the put side. This indicates a market expectation of limited upside potential but a large potential for downside movements.
For example, for the 1-week expiry on March 13, 2020, there was, according to these curves, virtually no chance the SPX would end above 3000, while a move down to 1500 was considered equally unlikely as a move above 3000. Despite these extreme shapes, these fitted vol curves are demonstrably free of butterfly and calendar arbitrage and form part of a fully arbitrage-free vol surface.
This is a testament to the robust design of the vol curves and the quality of the fitter, preventing arbitrage even when market mids might otherwise suggest its presence. As always, the fits shown here were produced in a fully automated fashion, using the default settings for the fitter — no fiddling by-hand was performed. Users only need to specify the curve types, and different curve types can be chosen for different expiries.